Try Aperture v5!
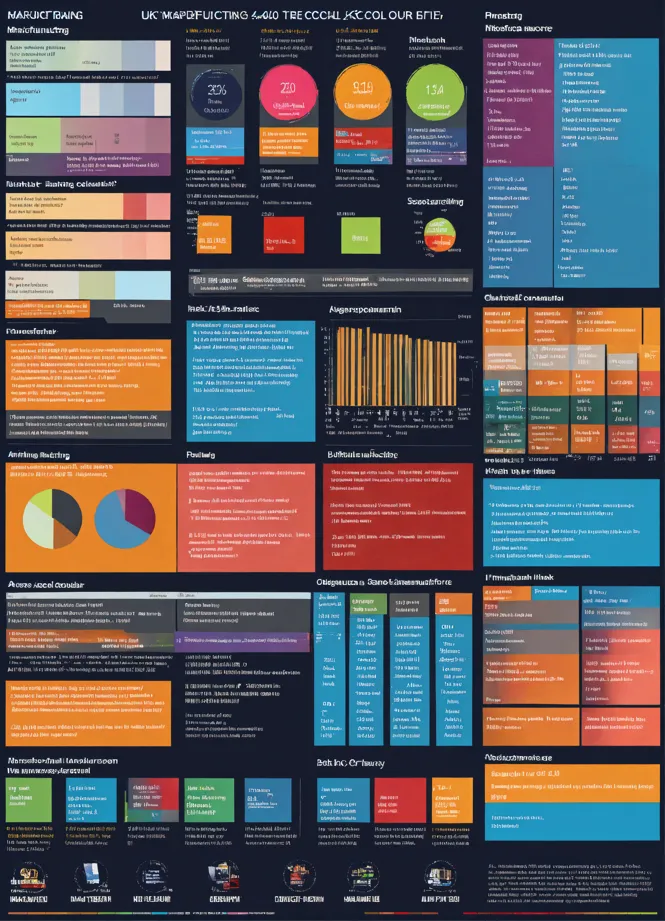
Uk manufacturing 4.0
Detailed, accurate, sharp, tech colour palette
A design that reflects the different types of audience user comments
Where there are the sad, the happy, the enthusiastic, and the ig...
EMERGENCY PROCEDURES
Create a diagram with different nodes in the diagram. Each of these notes will represent apps and th...
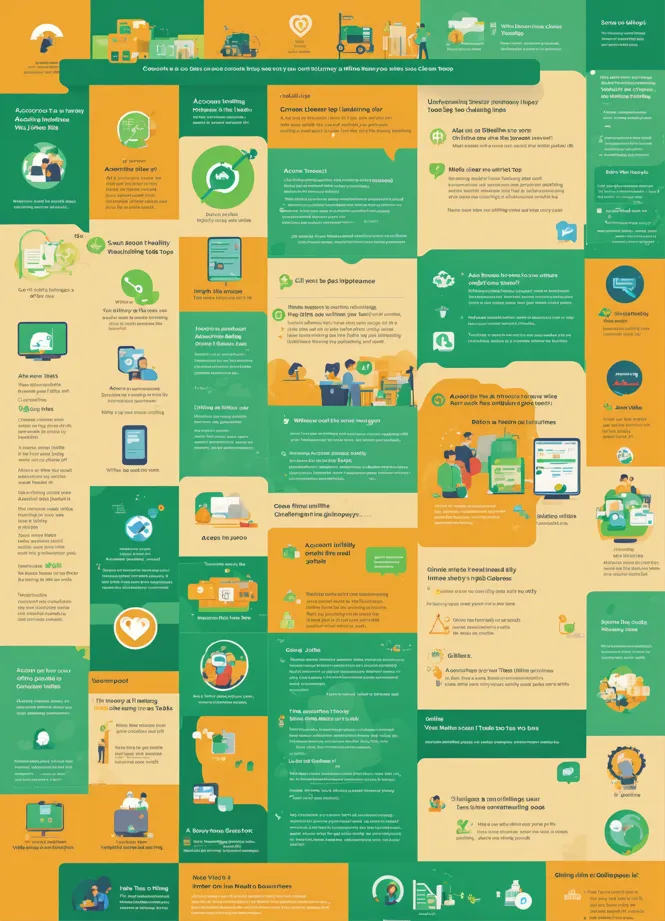
Create a clean and simple illustration that guides a diverse range of health insurance company cust...
Accented by bright green highlights. Information should be displ...
A cool looking graph that just goes up
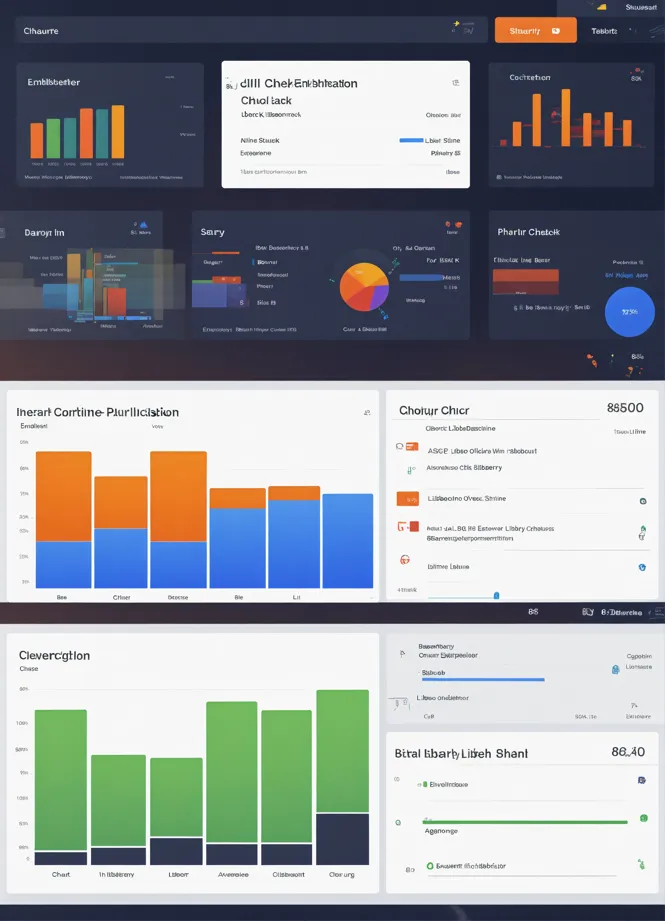
Dashboard displaying various graphs and icons A bar chart for library check-ins
A line graph for online course logins, pie chart for extracurric...
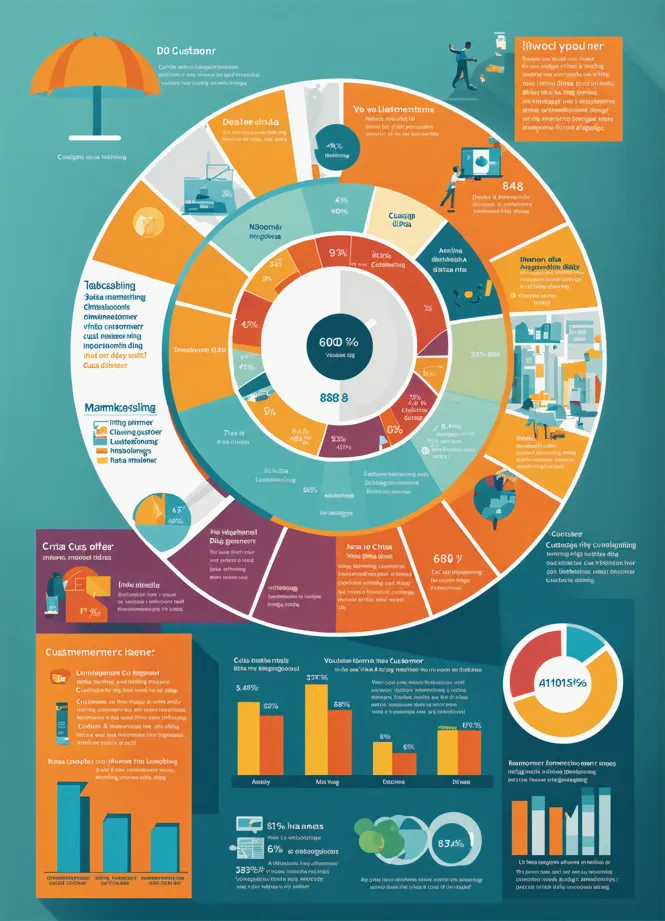
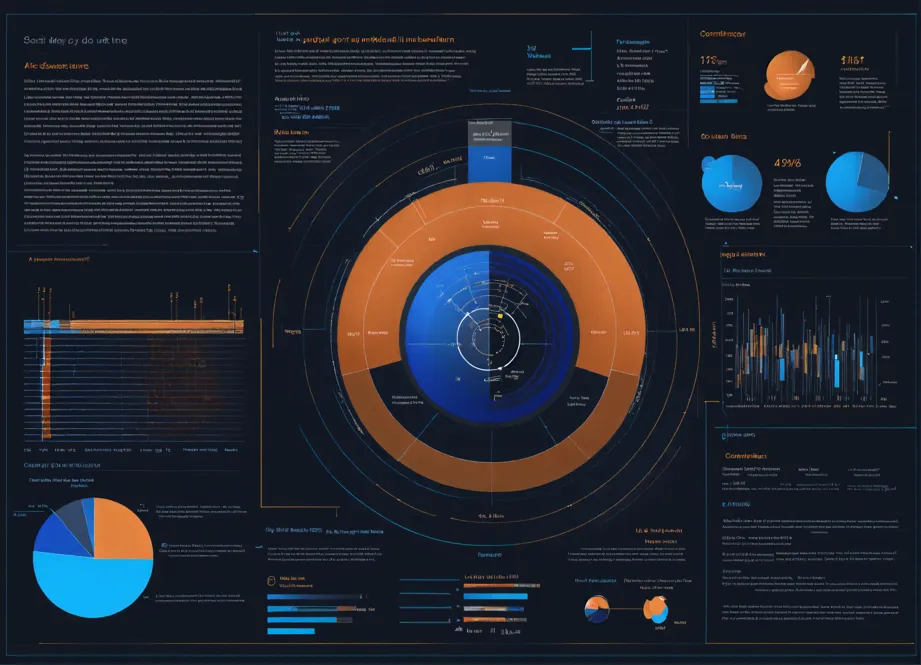
Create an infographic-style poster that visually represents customer data. Use charts
Graphs, and illustrations to convey customer demographics, prefe...
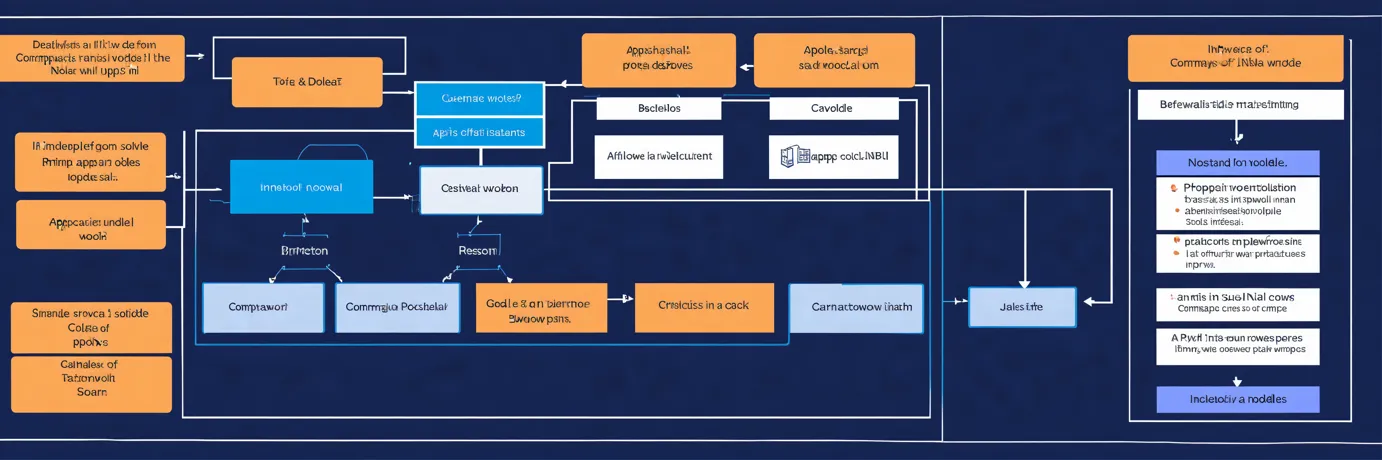
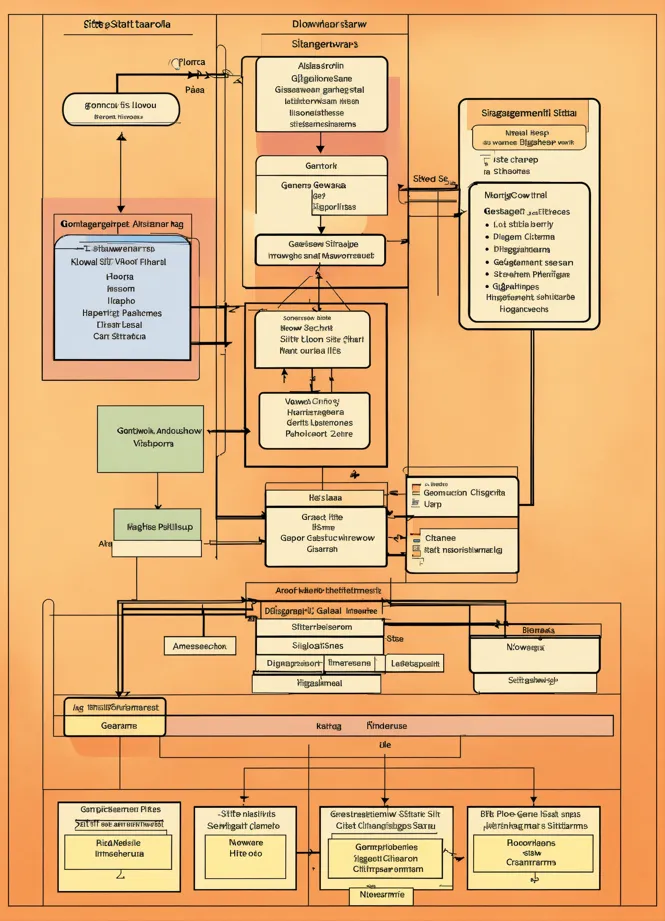
Generate an image that portrays Sitemap Diagrams Create visual representations of sitemaps using dia...
Diagram design with data
On a black background, ultramarine color
A simple flowchart of technology symbols that represents a collaboration network for use as a slide ...
Kodak colour quality, 8K.