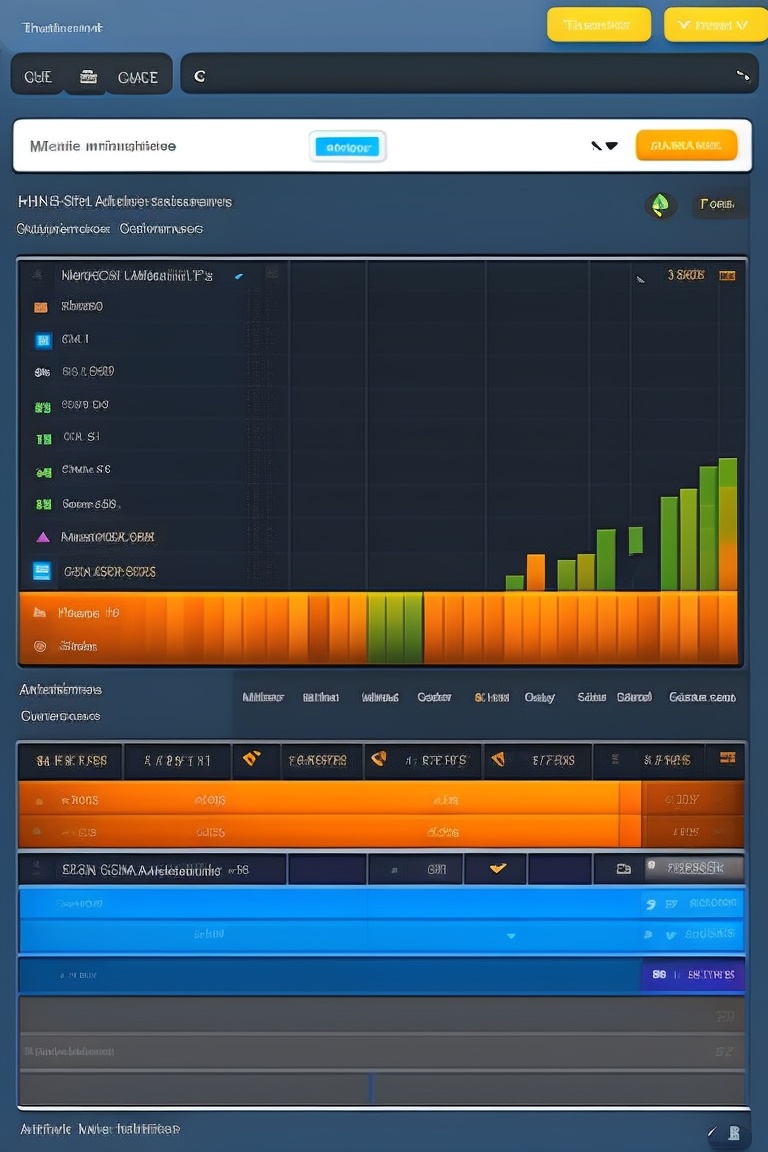
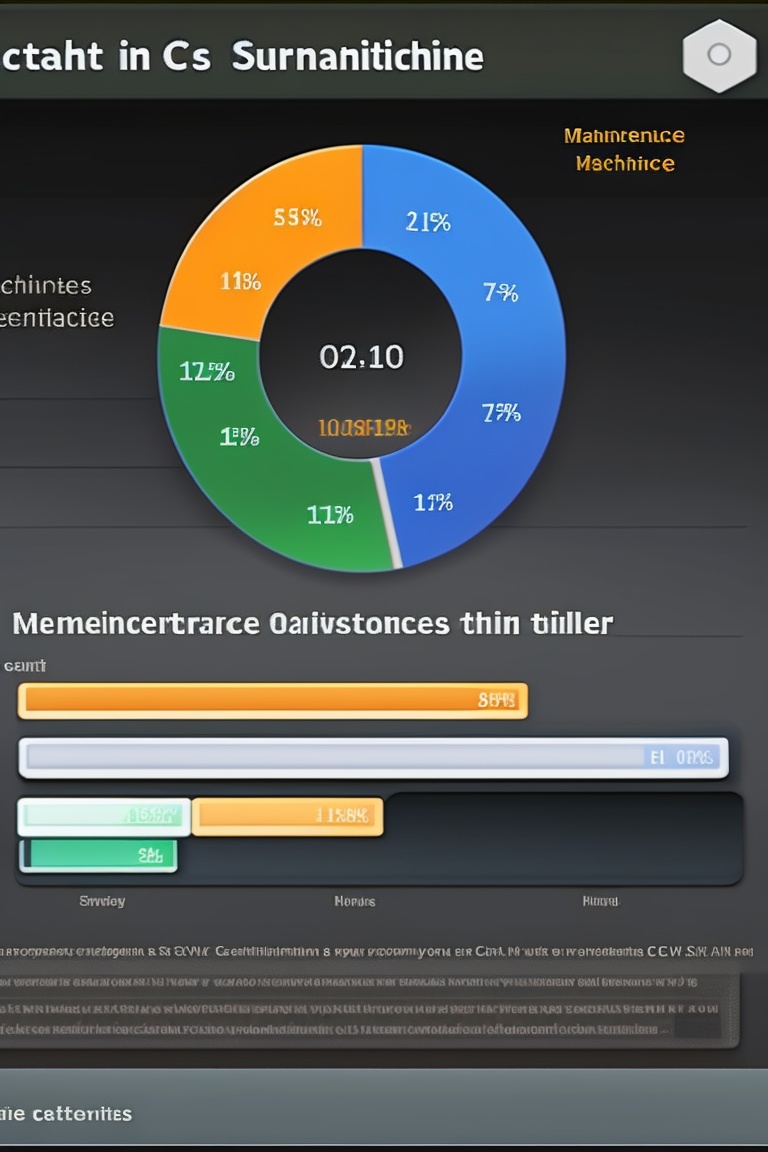
On the screen, there is a bar graph that shows the availability of machines in a certain period of time. below the graph, there is a table that shows the history of downtime due to maintenance, including the type of maintenance performed. to the right of the table, there is a pie chart that shows the statistic of hit alerts. there are also buttons to generate pdf and csv reports.
Copy prompt
Copy URL
Open in editor
Model
Aperture v3
Guidance scale
7
Dimensions
768 × 1152


